
September 2026 Disposable Gloves Market Report: Trade, Prices & Supply
The disposable gloves market continued to show mixed trends in September 2026. China's nitrile and vinyl glove export volumes increased during the first eight months of the year, while trade performance varied across major glove-producing countries. Meanwhile, rising prices for several petrochemical raw materials and energy inputs added new considerations for manufacturers and international buyers.
For disposable glove importers, distributors, wholesalers, and private-label brands, these developments highlight the importance of monitoring international trade patterns, upstream production costs, and supply chain conditions.
This article examines the latest available glove trade statistics, China's medical and industrial glove export performance, September 2026 raw material price movements, and their implications for B2B sourcing and procurement decisions.
1. Executive Summary: Key Market Findings
Five developments stand out in the September 2026 market data.
China's glove export value increased by 13.4%. During January–June 2026, China's reported glove export value reached approximately USD 740 million, compared with USD 650 million during the same period in 2025, reflecting strong export performance.
China's vinyl glove exports grew by 13.8%. From January to August 2026, cumulative vinyl glove exports reached 66.77 billion pieces, with August shipments totaling 8.65 billion pieces.
Medical nitrile glove exports maintained positive growth. China exported 57.17 billion medical nitrile gloves during the first eight months of 2026, up 7.6% year over year. Exports in the industrial glove category covered by the underlying trade data also increased by 9.5%.
US glove import volumes continued to recover. US imports of nitrile and latex gloves reached 69.18 billion pieces during January–July 2026, an increase of 9.4% year over year, although the distribution of imports among supplier countries continued to change.
Upstream material and energy prices increased. In September 2026, China's average nitrile latex price rose by 15.5% month over month, while butadiene and DOTP prices increased by 21.5% and 14.4%, respectively.
Overall, the figures indicate continued export-volume growth in several glove categories, alongside evolving sourcing patterns and manufacturing cost conditions.
2. Global Glove Supply and Export Trends
Major Exporting Countries: Malaysia and China Remain Leading Suppliers
International trade databases, including the International Trade Centre's Trade Map, provide a basis for examining export values, destination markets, and trade developments.
Official trade statistics covering major glove-exporting countries show that Malaysia and China continued to lead in export value among the markets reviewed.
In 2025, the reported export values were:
- Malaysia: USD 2.36 billion
- China: USD 1.27 billion
- Thailand: USD 840 million
- Indonesia: USD 230 million
- Vietnam: USD 140 million
Malaysia's export value declined from USD 2.48 billion in 2024 to USD 2.36 billion in 2025. China's export value decreased from USD 1.53 billion to USD 1.27 billion, while Thailand's declined from USD 920 million to USD 840 million.
In contrast, Indonesia and Vietnam recorded continued growth over the same period.
For additional historical context, explore the December 2025 Disposable Gloves Market Report, which examines earlier changes in trade flows, pricing, and supply conditions.
Export value trends reflect changes in international trade activity, including shipment volumes, average selling prices, and market conditions. These developments provide valuable insights into the evolving global glove supply landscape.
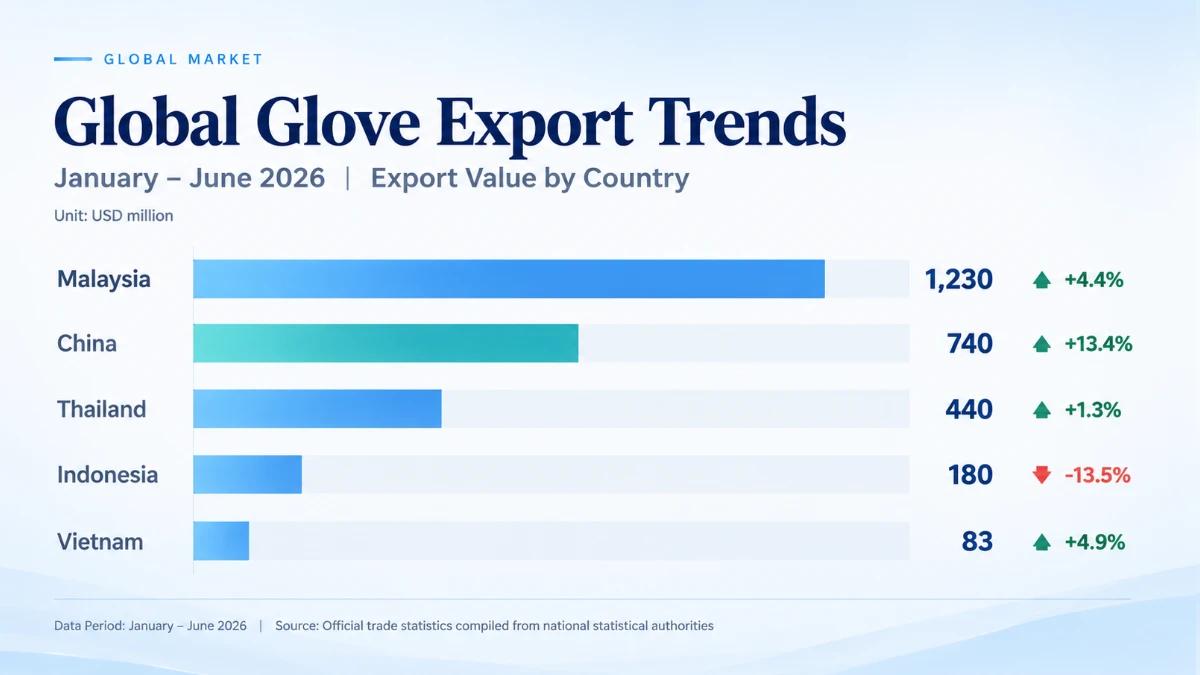
Export Performance During January–June 2026
The first half of 2026 showed differing results across major exporting countries:
- Malaysia: USD 1.23 billion, up 4.4% year over year
- China: USD 740 million, up 13.4%
- Thailand: USD 440 million, up 1.3%
- Indonesia: USD 180 million, down 13.5%
- Vietnam: USD 83 million, up 4.9%
China recorded strong year-over-year growth in glove export value, while Malaysia maintained the largest export value among the countries reviewed.
The differences in export performance highlight the changing competitive landscape across Asia's glove manufacturing industry.
Different Countries Serve Different Regional Markets
Export-destination data for January–June 2026 revealed distinct geographic patterns.
Europe accounted for 66.9% of China's exports within the reported trade category. North America accounted for 10.4%, followed by Asia at 10.7%.
For Malaysia, North America was the leading destination, accounting for 51.9%, followed by Europe at 27.4% and Asia at 14.3%.
Thailand's largest destination was also North America, representing 43.3% of exports.
Indonesia and Vietnam were particularly concentrated in North America, with destination shares of 76.5% and 85.2%, respectively.
These differences underline the importance of understanding regional supply structures rather than treating Asia's glove manufacturing industry as a single market.
What This Means for Buyers
Country-level trade statistics can help identify established sourcing regions. Selecting a manufacturing partner also requires evaluating product specifications, quality management systems, relevant certifications, production capabilities, and delivery arrangements.
3. Global Demand and Import Market Trends
Major Importing Countries Showed Different Trends
International trade statistics under HS Code 401512 showed mixed import-value movements during January–June 2026.
Among the major importing markets reviewed:
- United States: USD 982 million, down 6.6% year over year
- Germany: USD 219 million, down 13.0%
- Brazil: USD 87 million, up 44.2%
- Netherlands: USD 82 million, up 22.6%
- Japan: USD 79 million, up 33.4%
- United Kingdom: USD 95 million, down 4.3%
- France: USD 58 million, up 7.6%
The United States remained the largest importing country in the comparison, despite its decline in import value.
Brazil, Japan, and the Netherlands recorded notable increases, while Germany and several other mature markets experienced declines.
Import value trends reflect both shipment volumes and average transaction prices, offering insights into the changing demand structure across global markets.
US Glove Imports: Volume Recovery and Sourcing Shifts
According to trade data available through the U.S. International Trade Commission's DataWeb, US imports of nitrile and latex gloves totaled 69.18 billion pieces during January–July 2026, up 9.4% year over year.
For comparison, the United States imported approximately 108.97 billion pieces in 2025 and 104.75 billion pieces in 2024.
The sourcing structure also changed substantially.
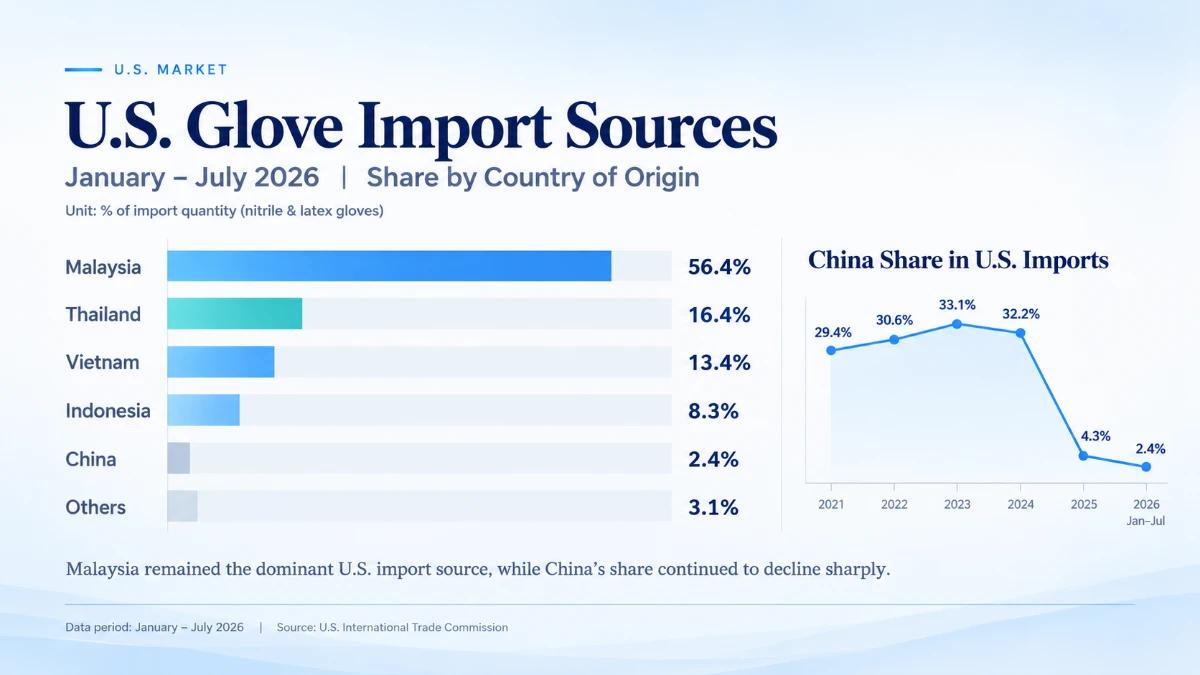
During January–July 2026, the main sources of US nitrile and latex glove imports by quantity were:
- Malaysia: 56.4%
- Thailand: 16.4%
- Vietnam: 13.4%
- Indonesia: 8.3%
- China: 2.4%
- Other countries: 3.1%
China's share declined substantially from 33.1% in 2023, while Malaysia maintained its leading position and Vietnam and Indonesia became increasingly important suppliers.
For a closer look at earlier sourcing patterns, see the U.S. Disposable Gloves Import Data Brief (Jan–Jul 2025).
Trade policies, country-of-origin rules, manufacturing investments, and cost competitiveness are relevant factors when evaluating these shifts. Their specific effects should be assessed using current product-level regulations and supplier information.
What This Means for Buyers
Importers supplying the US market should compare total landed costs, applicable duties, product compliance, country of origin, and supplier reliability rather than focusing exclusively on factory quotations.
4. China's Nitrile and Vinyl Glove Export Performance
Trade statistics from the General Administration of Customs of China provide insight into export performance across vinyl, medical nitrile, and other disposable glove categories.
Vinyl Gloves: Strong Export-Volume Growth
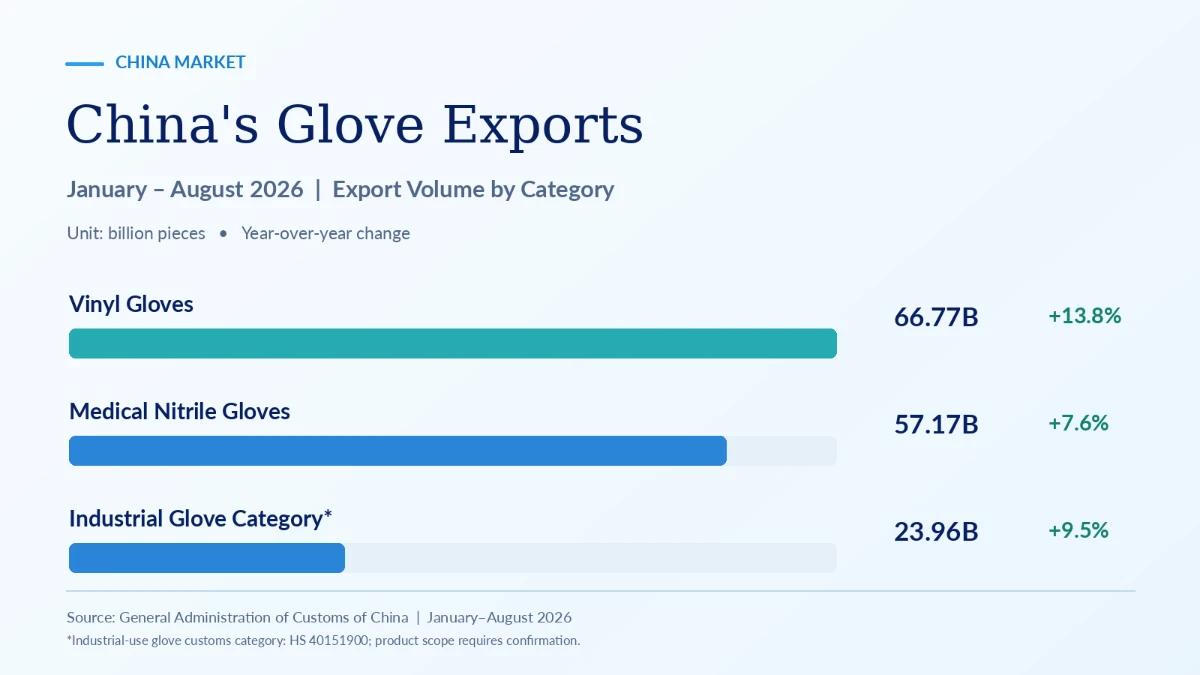
According to China's customs statistics under HS Code 39262011, vinyl glove exports reached 66.77 billion pieces during January–August 2026, increasing 13.8% year over year.
In August alone, exports reached 8.65 billion pieces, representing a 2.7% year-over-year increase and a 1.37% month-over-month decline.
North America accounted for 45.7% of August shipments, followed by Asia excluding Japan and South Korea at 19.7%, Japan and South Korea at 15.7%, and Europe at 12.2%.
During January–August, the largest destination markets included:
- United States: 27.207 billion pieces
- Japan: 12.289 billion pieces
- Saudi Arabia: 3.988 billion pieces
These figures highlight the continued importance of North America, Japan, and selected Middle Eastern markets for China's vinyl glove exports.
For distributors, market demand should be evaluated alongside product requirements such as intended application, fit, packaging, and applicable market regulations.
Medical Nitrile Gloves: Europe Remains the Primary Export Destination
China's medical nitrile glove exports under HS Code 40151200 totaled 57.17 billion pieces during January–August 2026, increasing 7.6% year over year.
August exports reached 7.42 billion pieces, up 6.5% month over month and 5.1% year over year.
Europe accounted for 63.6% of August shipments, followed by North America at 13.0%, South America at 7.6%, and Asia excluding Japan and South Korea at 7.0%.
Major destinations during January–August included:
- Germany: 7.79 billion pieces
- United Kingdom: 6.24 billion pieces
- Poland: 4.05 billion pieces
- Spain: 3.97 billion pieces
- Canada: 3.59 billion pieces
The regional concentration indicates Europe's importance in China's medical glove export structure.
For European healthcare distributors, product selection must also account for relevant medical device requirements, product documentation, and applicable standards.
Industrial Glove Exports: A More Diversified Destination Structure
Under the HS Code 40151900 classification used for the industrial glove category in the underlying analysis, China exported 23.96 billion pieces during January–August 2026, an increase of 9.5% year over year.
August exports reached 2.97 billion pieces, down 8.9% month over month and 2.6% year over year.
The August regional distribution was comparatively balanced:
- Europe: 27.2%
- North America: 23.7%
- Japan and South Korea: 22.7%
- Asia excluding Japan and South Korea: 14.4%
- South America: 8.9%
Japan was the largest reported destination during January–August, receiving 5.28 billion pieces, followed by the United States at 3.19 billion pieces.
Industrial buyers should match disposable glove specifications to the intended working environment, including grip, durability, chemical exposure conditions, and applicable protective standards.
5. September 2026 Raw Material and Energy Price Trends
Raw material and energy prices are important indicators for glove manufacturing costs, particularly for nitrile and vinyl products.
China market price data for August and September 2026 showed different movements across major inputs.
Nitrile Glove Raw Materials
Nitrile Latex: The September average increased to RMB 7,843 per metric ton from RMB 6,793 in August, representing a 15.5% month-over-month rise.
Butadiene: The average price increased from RMB 11,708 to RMB 14,220 per metric ton, up 21.5%.
Acrylonitrile: The average price decreased from RMB 12,326 to RMB 11,328 per metric ton, down 8.1%.
To understand how upstream material changes influence manufacturing, explore how petrochemical costs impact disposable glove production.
These contrasting movements demonstrate how different upstream materials contribute to the overall production cost environment.
Nitrile latex prices also fluctuated within September, rising earlier in the month before easing as lower-priced supply entered the market.
Vinyl Glove Raw Materials
PVC Paste Resin: The September average was RMB 6,873 per metric ton, compared with RMB 6,929 in August, representing a 0.8% decline.
DOTP Plasticizer: The September average reached RMB 10,240 per metric ton, increasing 14.4% from RMB 8,950 in August.
The difference between PVC paste resin and DOTP price movements highlights the importance of monitoring multiple inputs rather than relying on a single indicator.
Energy Prices
Thermal Coal: The September average reached RMB 819 per metric ton, up 23.5% month over month.
Liquefied Natural Gas (LNG): The September average reached RMB 6,160 per metric ton, up 9.7%.
Changes in energy costs may affect manufacturing economics, although the actual impact varies depending on production location, energy mix, purchasing arrangements, and operational efficiency.
What This Means for Buyers
Raw material price movements provide useful reference points for procurement planning. Finished glove quotations reflect multiple factors, including material consumption, manufacturing operations, packaging, logistics, and commercial arrangements.
6. Market Spotlight: Raw Material Volatility and Changing Trade Flows
The September 2026 data highlights two developments occurring at the same time: rising upstream input costs and changing international glove sourcing patterns.
China recorded positive cumulative export-volume growth across vinyl gloves, medical nitrile gloves, and the reported industrial glove category. Meanwhile, Malaysia, Thailand, Vietnam, and Indonesia continued to supply a substantial proportion of US nitrile and latex glove imports.
For global buyers, these changes raise two practical questions.
Where Should Buyers Source Disposable Gloves?
Country-level import and export data can indicate established manufacturing and trade relationships. However, country of origin is only one element of supplier evaluation.
Product specifications, manufacturing capabilities, compliance documentation, quality consistency, and delivery reliability remain important.
How Should Buyers Plan Purchases During Periods of Cost Volatility?
Raw material trends may influence manufacturing costs and quotation conditions, but their effects can vary depending on inventory, purchasing agreements, and production arrangements.
Buyers should combine market monitoring with supplier communication, realistic demand forecasts, and clear commercial agreements.
7. Practical Sourcing Considerations for Distributors and Importers
Evaluate Total Landed Cost Instead of Unit Price Alone
When comparing disposable glove suppliers across countries, buyers should assess product quotations together with applicable tariffs, freight, insurance, customs requirements, and delivery terms.
Total landed cost provides a more useful basis for international purchasing decisions than factory price alone.
For a more detailed breakdown of production expenses and landed costs, read our B2B guide to nitrile glove costs.
Define Glove Specifications Before Requesting Quotations
Medical examination, food-handling, and industrial disposable gloves may differ in material composition, performance requirements, packaging, and regulatory documentation.
Before requesting quotations, importers should clarify their intended application, material preference, size distribution, product specifications, estimated order volume, and destination market.
Buyers evaluating potential manufacturing partners can also refer to this medical glove supplier selection guide for additional procurement considerations.
Monitor Upstream Costs and Quotation Conditions
Raw material market movements can support procurement planning by providing insight into changes in the manufacturing cost environment.
Buyers can discuss quotation validity, anticipated lead times, and purchasing arrangements with suppliers to manage cost uncertainty.
Plan Recurring Orders and Supply Requirements
For distributors managing regular orders, accurate volume forecasts and early confirmation of product requirements can support more predictable purchasing cycles.
Supplier capabilities should be evaluated over time, including quality consistency, production planning, communication, and logistics coordination.
8. INTCO Medical: Disposable Glove Manufacturing and Supply
INTCO Medical is a global disposable glove manufacturer with an annual production capacity of 107 billion gloves, including 74 billion nitrile gloves and 33 billion vinyl gloves.
Learn more about INTCO's advanced glove manufacturing capabilities, including production infrastructure, manufacturing automation, and global supply operations.
INTCO provides disposable glove products for wholesale distribution and private-label cooperation, supporting different B2B sourcing requirements.
Importers and distributors considering long-term cooperation can explore INTCO's manufacturing capabilities, product portfolio, quality management systems, and relevant compliance documentation.
Looking for a reliable disposable glove manufacturing partner?
Contact INTCO Medical to discuss your target market, product requirements, estimated purchase volume, and sourcing needs.
9. Frequently Asked Questions
What were the main disposable glove market trends in September 2026?
The latest available market data showed increasing cumulative Chinese glove exports in several product categories, changing international sourcing patterns, and higher prices for selected raw materials and energy inputs.
Did China's nitrile glove exports increase in 2026?
Yes. From January to August 2026, China's medical nitrile glove exports increased by 7.6% year over year to 57.17 billion pieces. The reported industrial glove export category increased by 9.5% to 23.96 billion pieces.
Which countries supplied the most nitrile and latex gloves to the United States?
During January–July 2026, Malaysia accounted for 56.4% of US imports by volume, followed by Thailand at 16.4%, Vietnam at 13.4%, Indonesia at 8.3%, and China at 2.4%.
How did nitrile glove raw material prices change in September 2026?
China's average nitrile latex price increased by 15.5% month over month. Butadiene rose by 21.5%, while acrylonitrile declined by 8.1%.
Do Higher Nitrile Latex Prices Automatically Lead to Higher Finished Glove Prices?
Finished glove quotations depend on multiple factors, including material costs, production efficiency, energy, packaging, logistics, and commercial arrangements. Raw material price movements do not necessarily translate directly into equivalent changes in finished glove prices.
What Should Distributors Consider When Choosing Disposable Glove Suppliers?
Important considerations include product specifications, applicable regulations, manufacturing capabilities, quality consistency, total landed cost, lead times, and support for recurring orders.
Data Sources
This article references trade statistics from the General Administration of Customs of China, the U.S. International Trade Commission (USITC), the International Trade Centre (ITC), and relevant national statistical authorities. Raw material price trends are based on industry market data. Reporting periods vary according to the availability of the latest statistics.